

Divorce trends in the United States have changed quite a bit over the past several decades. Divorce is still a common experience for many families, but the overall divorce rate has steadily declined and is now near its lowest level in almost 50 years.
If you’re looking for the current U.S. divorce rate, wondering how many marriages end in divorce, or trying to understand who is most likely to divorce, this guide brings the latest research available in one place. The statistics come from sources such as the Centers for Disease Control and Prevention (CDC), the U.S. Census Bureau, Pew Research Center, and the National Center for Family & Marriage Research (NCFMR).
Reviewed by: Craig Valentine, Chief Practice Officer
Key U.S. Divorce Statistics at a Glance
Here are some of the most important facts about divorce in the United States based on the latest available data.
The U.S. divorce rate has fallen over the past four decades and is now near its lowest level in almost 50 years.
| Statistic | Latest Data & Insight |
|---|---|
| Trend Over Time | The U.S. divorce rate has steadily declined since it peaked in the early 1980s. |
| Ever-Married Americans Who Have Divorced | About one-third of Americans who have ever been married have experienced a divorce. |
| Median Marriage Length Before Divorce | The median marriage ending in divorce lasts 12 years. |
| Divorces Within the First 10 Years | About 40% of divorces happen during the first decade of marriage. |
| Gray Divorce | Nearly 40% of divorces involve someone age 50 or older. |
| Common Misconception | The familiar claim that “50% of marriages end in divorce” is outdated. Divorce risk varies based on age at marriage, education, income, and whether it is a first or later marriage, so one percentage cannot tell the whole story. |
Sources: CDC, Pew Research Center, U.S. Census Bureau, and NCFMR. Statistics reflect the most recent data available as of July 2026.
Government agencies and research groups publish divorce data on different schedules. We regularly review this guide and update it when new data becomes available from the CDC, U.S. Census Bureau, Pew Research Center, and NCFMR.
Table of Contents
- What Is the Current U.S. Divorce Rate?
- How Has the U.S. Divorce Rate Changed Over Time?
- What Percentage of Marriages End in Divorce?
- What Percentage of First Marriages End in Divorce?
- How Long Does the Average Marriage Last Before Divorce?
- Are Second and Third Marriages More Likely to End in Divorce?
- Divorce Statistics by Age
- Gray Divorce Statistics
- Who Is Most Likely to Divorce?
- What Percentage of Divorces Are Initiated by Women?
- What Is the Most Common Reason for Divorce?
- Divorce Rates by State
- The Financial Impact of Divorce
- Frequently Asked Questions
- How Modern Family Law Can Help
What Is the Current U.S. Divorce Rate?
The current U.S. divorce rate is 2.4 divorces per 1,000 people, according to the latest available data from the Centers for Disease Control and Prevention. This is called the crude divorce rate because it compares the number of divorces and annulments with the country’s total population.
That rate is much lower than it was in the late 1970s and early 1980s, when divorce was at its highest point in the United States. Still, the decline does not mean divorce is rare. Americans are marrying later, fewer people are getting married, and today’s married population is different from earlier generations in ways that may affect divorce rates.
The crude divorce rate counts divorces per 1,000 people in the total population. The refined divorce rate counts divorces among people who are married and could get divorced. Because these rates measure different groups, they should not be compared as if they mean the same thing.
The numbers can also change based on the dataset, year, and type of rate used. For example, 2.4 divorces per 1,000 people does not mean that only 0.24% of marriages will eventually end in divorce. That is a different question, which we explain later in this guide.
Source: Centers for Disease Control and Prevention, National Center for Health Statistics, most recent available national marriage and divorce data.
How Has the U.S. Divorce Rate Changed Over Time?
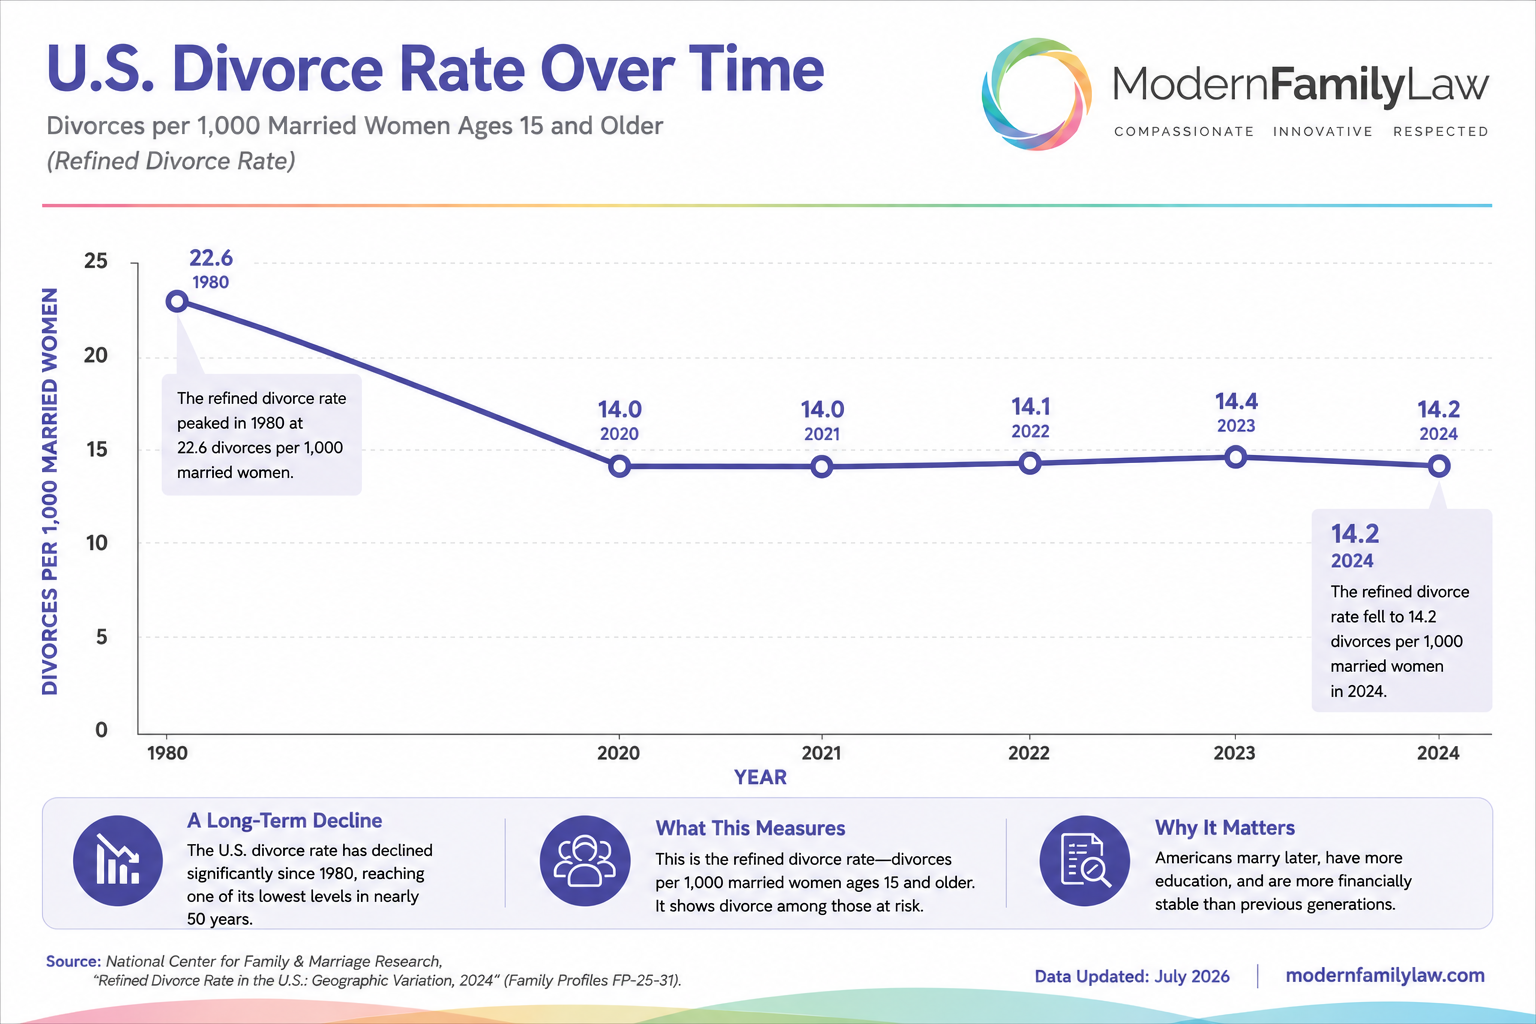
The U.S. divorce rate has fallen since it peaked in 1980. NCFMR’s 2024 refined divorce rate analysis reports that the refined divorce rate reached 22.6 divorces per 1,000 married women in 1980. By 2024, it had dropped to 14.2 per 1,000 married women.
There is no single reason for this change. Americans tend to marry later than earlier generations, and fewer people marry overall. People who marry later may also begin marriage with more education, financial stability, and life experience.
Key Takeaway
Divorce is still common, but the rate is far lower than it was several decades ago. The decline reflects changes in when people marry, who gets married, and how common marriage is—not one single social or economic cause.
How the rate is calculated also matters. Some sources count divorces per 1,000 people in the total population, while others count divorces only among married adults. Both can be useful, but they answer different questions.
Sources: National Center for Family & Marriage Research, “Divorce: More Than a Century of Change, 1900–2022” and “Refined Divorce Rate in the U.S.: Geographic Variation, 2024”; Centers for Disease Control and Prevention, National Marriage and Divorce Rate Trends.
What Percentage of Marriages End in Divorce?
There is no single percentage that can tell us how many U.S. marriages will eventually end in divorce. The often-repeated claim that 50% of marriages end in divorce is not a current government statistic, and it should not be treated as a prediction for couples marrying today.
According to a 2025 Pew Research Center analysis, about one-third of Americans who have ever been married have also experienced a divorce. That number describes people’s past experiences. It does not mean one-third of all new marriages will end in divorce.
Do Half of All Marriages End in Divorce?
The familiar 50% figure makes a complicated question sound simple. Divorce statistics may measure annual divorce rates, past experiences with divorce, separation, or estimates of what could happen over a lifetime. Those measurements are not interchangeable.
This is not a reliable measure of how many marriages beginning today will eventually end. The figure often comes from older projections or from comparing the number of marriages and divorces reported in one year.
Pew Research Center found that about one-third of Americans who have ever married have experienced a divorce, based on 2023 Census Bureau data.
Counts divorces that happen during a particular year.
Measures how many people who have ever married have experienced at least one divorce.
Estimates what may happen to marriages over time using assumptions that can change.
Older research has sometimes been used to support estimates close to 50%. For example, a CDC study found that 43% of first marriages among women ages 15 to 44 ended in separation or divorce within 15 years. That figure included separation as well as divorce, focused on a specific age and gender group, and did not represent every U.S. marriage.
Divorce risk also varies based on whether it is a first or later marriage, how old each person was when they married, education, income, and when the marriage began. One percentage cannot describe the likely outcome of every marriage.
Key Takeaway
It is more accurate to say that divorce remains common, but the claim that exactly half of all marriages end in divorce is too broad. Current data shows that about one-third of ever-married Americans have experienced a divorce. We cannot yet know the final outcome of marriages beginning today.
What Percentage of First Marriages End in Divorce?
There is no current statistic that can predict how many first marriages will eventually end in divorce. The strongest national research either tracks first marriages for a set number of years or measures how many people in a first marriage divorce during a particular year.
First-Marriage Divorce Statistics in Context
Important context: The 43% figure comes from older CDC research involving women ages 15 to 44. It includes separation as well as divorce and should not be presented as a current lifetime prediction for every first marriage.
NCFMR reports that the annual first-divorce rate fell between 2008 and 2023. It dropped from 18.7 to 13.4 divorces per 1,000 women in a first marriage and from 16.9 to 11.5 per 1,000 men. These numbers show that first divorce has become less common, but they do not tell us how many marriages beginning today will eventually end.
Key Takeaway
No single percentage applies to every first marriage. Current annual first-divorce rates are much lower than they were in 2008. Older studies can still provide context, but only when their population, timeframe, and use of both separation and divorce are clearly explained.
Sources: National Center for Family & Marriage Research, “First Divorce Rate, 2023”; Centers for Disease Control and Prevention, “First Marriage Dissolution, Divorce, and Remarriage.”
How Long Does the Average Marriage Last Before Divorce?
The median length of a U.S. marriage ending in divorce was 12 years in 2023. That means half of those marriages lasted less than 12 years and half lasted 12 years or longer.
There is plenty of variation. Four in ten divorces happen during the first decade of marriage, while nearly one in four happen after at least 25 years.
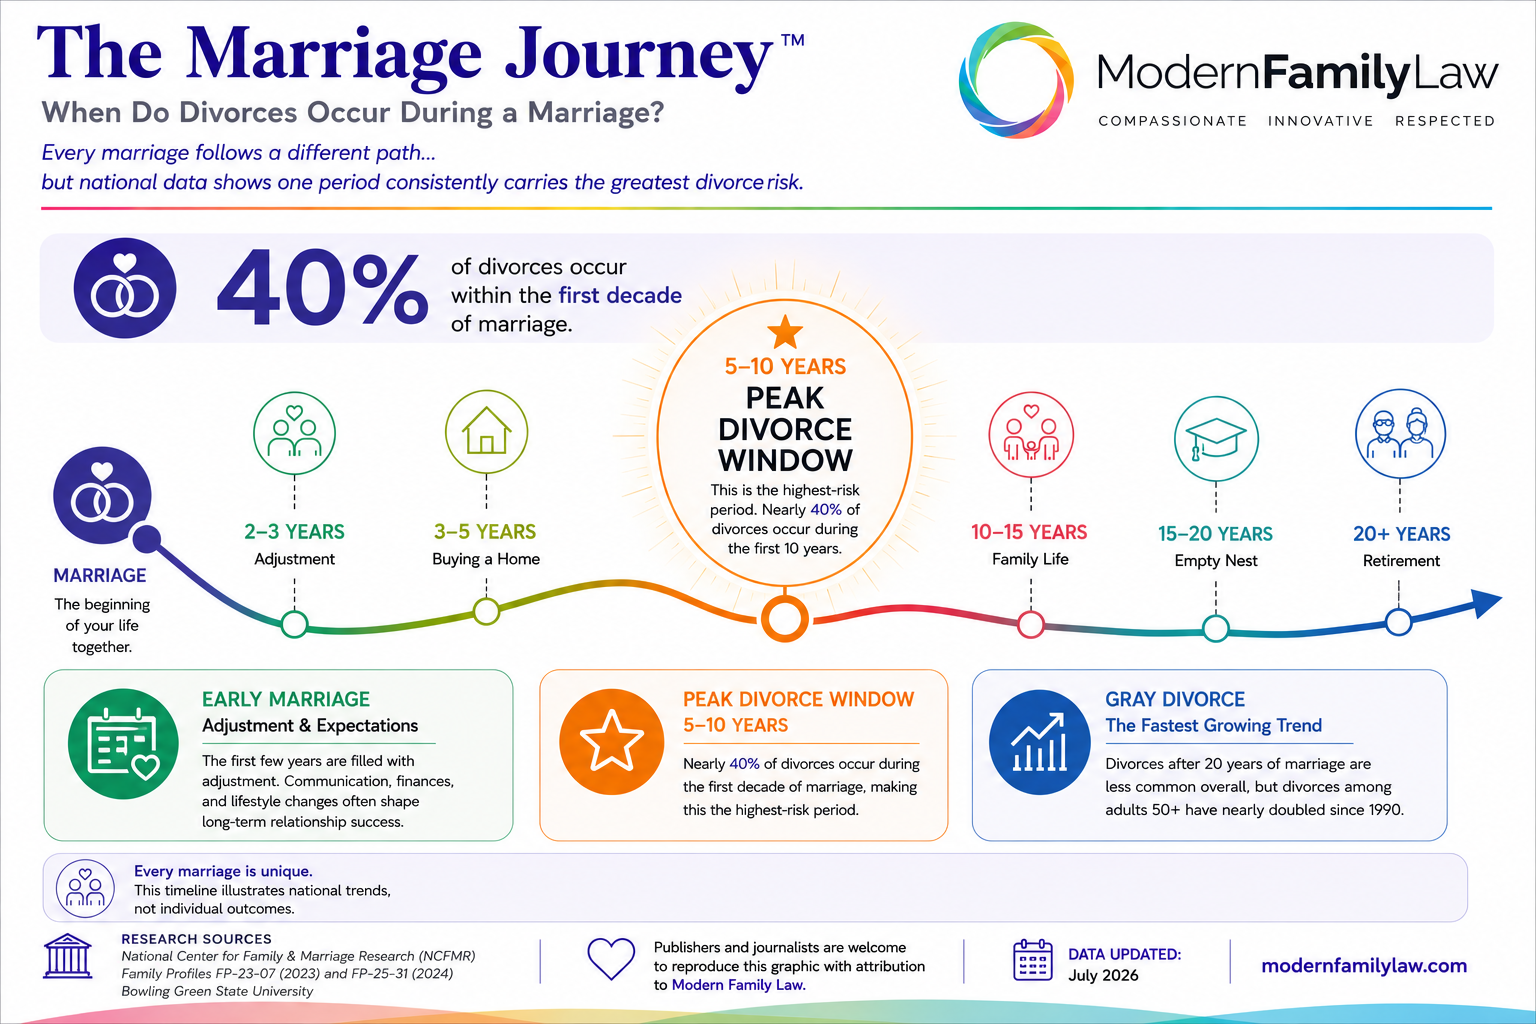
In 2023, 16% of divorces happened before the fifth wedding anniversary. Another 24% happened between five and nine years of marriage. Together, those groups made up 40% of divorces.
Divorce is not limited to newer marriages. Twenty-two percent of divorces happened after at least 25 years of marriage. This is one reason later-life divorce has become an important part of the larger picture.
Key Takeaway
The median marriage ending in divorce lasts 12 years, but there is no set point when a marriage is most likely to end. Four in ten divorces happen within the first decade, while more than one in five happen after 25 years or more.
Are Second and Third Marriages More Likely to End in Divorce?
Research has found that second and later marriages can be less stable than first marriages. However, there is no reliable, current national source showing that exactly 60% of second marriages or 73% of third marriages end in divorce. Those figures appear often online, but they are rarely tied to recent data from the CDC, Census Bureau, Pew Research Center, or NCFMR.
What current research does show is that remarriage is common. Pew Research Center reports that about two-thirds of Americans who have experienced a divorce have married again. Divorced men are slightly more likely than divorced women to remarry.
What the Data Says About Remarriage
About two-thirds of Americans who have experienced a divorce have gone on to remarry.
Many people build a new marriage after divorce, although remarriage rates have declined in recent years.
Earlier CDC research found that 26% of second marriages among women ages 15 to 44 ended in separation or divorce within five years.
The stability of a marriage can be affected by age, finances, children, earlier relationships, and how long the marriage has lasted.
The claims that 60% of second marriages and 73% of third marriages end in divorce are often repeated without a clear, current primary source. They should not be treated as definitive national divorce rates.
Later marriages may come with circumstances that are less common in a first marriage. Spouses may be combining households, co-parenting with former partners, raising children or stepchildren, dividing financial responsibilities, and carrying stress from earlier relationships.
Remarriage patterns are changing, too. NCFMR found that the remarriage rate fell between 2008 and 2023. Among previously married men, it dropped from 48.9 to 34.4 remarriages per 1,000 eligible men. Among previously married women, it fell from 25.2 to 18.5 per 1,000.
Those numbers tell us how often previously married adults remarry. They do not tell us how many remarriages later end in divorce.
Key Takeaway
Second and later marriages may come with added pressure, but the often-quoted 60% and 73% figures should be treated with caution. Reliable research shows that remarriage is common and that some second marriages end within the first several years, but no single percentage predicts what will happen in every remarriage.
Divorce Statistics by Age
Divorce rates are different at different ages. Younger adults generally have higher divorce rates, while marriages that begin later in life tend to be more stable. At the same time, divorce among adults over 50 has changed sharply over the past several decades. This trend is often called gray divorce.
People who marry very young may face financial pressure, career changes, and personal growth early in the marriage. Those who marry later may have more financial security and life experience, which research has linked to lower divorce rates.
How Divorce Risk Changes Throughout Life
Every marriage is different, but national research shows that divorce patterns shift across adulthood.
People who marry in their early twenties generally face the highest divorce risk. Money pressures, career development, and personal growth can all affect a relationship during these years.
Many marriages become more stable during these years, although parenting, work demands, and financial pressure can still strain a relationship.
Although the overall divorce rate has declined, divorce among adults over 50 rose sharply for many years. That change led researchers to use the term gray divorce.
Research consistently finds that marrying later in life is associated with a lower likelihood of divorce. While there is no “perfect” age to marry, waiting until the late twenties or later has generally been linked with greater marital stability.
Age is only one part of the picture. Education, household income, earlier marriages, children, and relationship satisfaction can all affect divorce patterns.
Key Takeaway
Divorce patterns change throughout life. Marriages that begin at younger ages generally face a higher divorce risk, while marriages that begin later tend to be more stable. Meanwhile, the rise in divorce among adults over 50 has changed how researchers understand marriage and divorce in the United States.
Sources: Pew Research Center; National Center for Family & Marriage Research (NCFMR); U.S. Census Bureau.
First-Divorce Rates by Age
The latest NCFMR analysis shows that first-divorce rates are highest among adults ages 18 to 29 and lowest among adults age 75 and older.
| Age group | Men | Women | Measure |
|---|---|---|---|
| 18-29 | 17.6 | 19.3 | First divorces per 1,000 people in a first marriage |
| All adults 18+ | 11.5 | 13.4 | First divorces per 1,000 people in a first marriage |
| 75+ | 2.8 | 5.1 | First divorces per 1,000 people in a first marriage |
Source: NCFMR analysis of 2023 American Community Survey data. These are annual first-divorce rates, not lifetime probabilities.
Gray Divorce Statistics
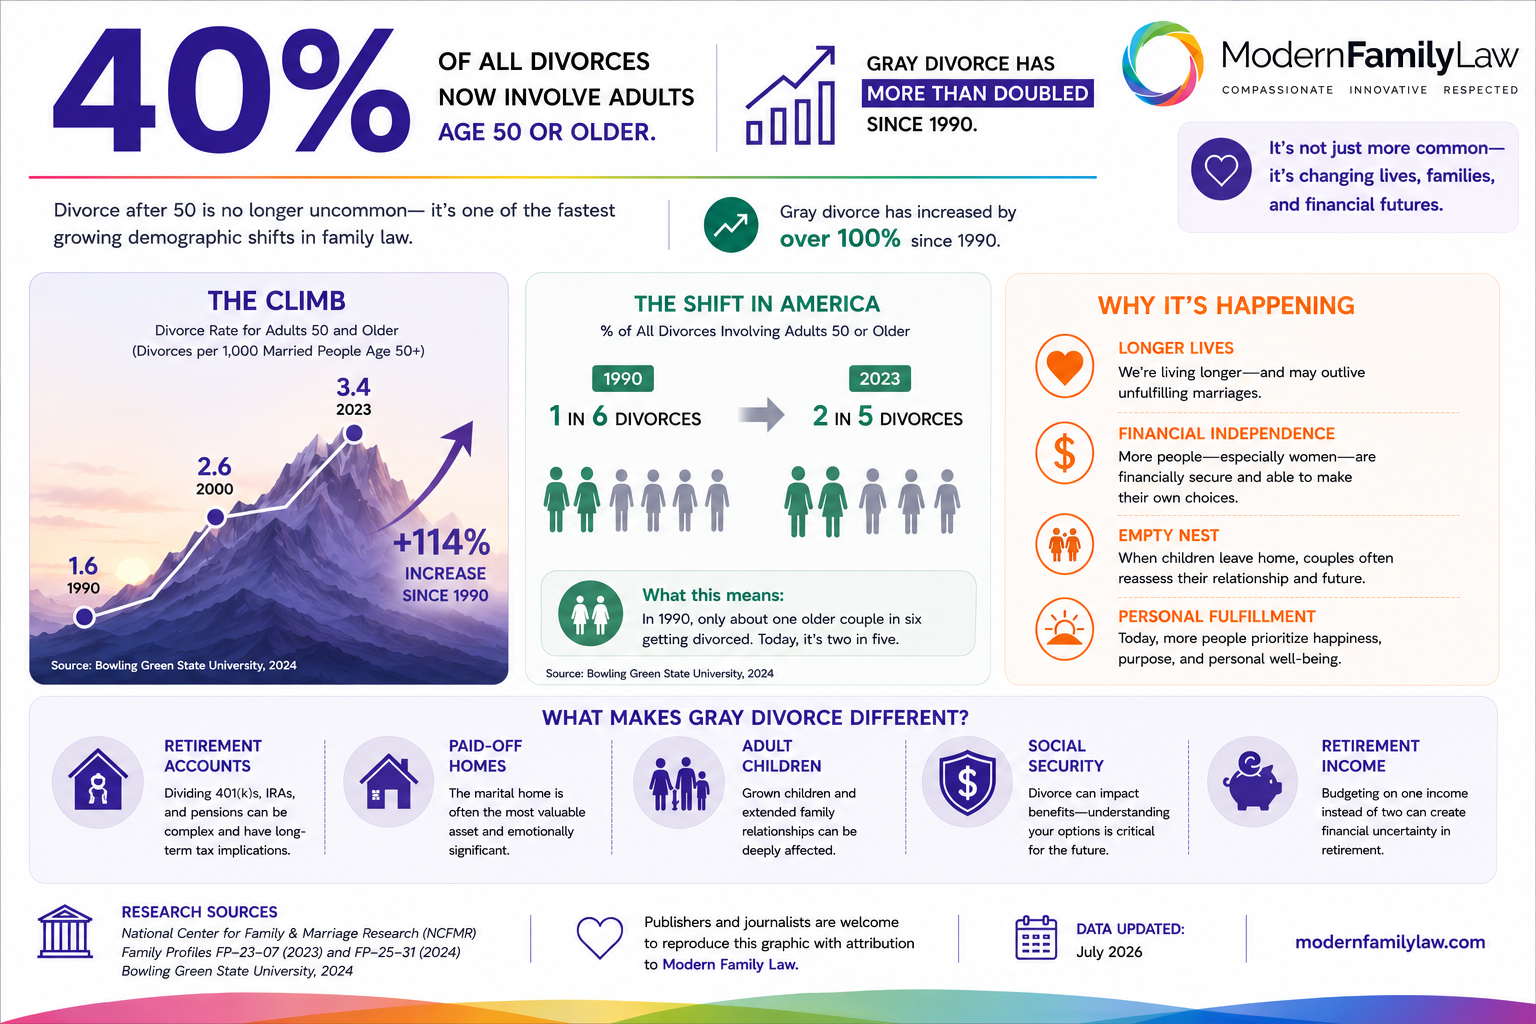
One of the biggest changes in U.S. divorce trends has been the rise of gray divorce, a term used for divorce after age 50. Although the overall divorce rate has declined, the rate among older adults rose sharply between 1990 and 2008 before leveling off in recent years.
Today, nearly 40% of divorces involve someone age 50 or older. Researchers point to several possible reasons, including longer lives, changing views about divorce, greater financial independence, and the aging Baby Boomer generation.
Divorce later in life can bring different financial and legal concerns. Spouses may need to divide retirement accounts and property, including pensions, investments, businesses, and real estate. Spousal maintenance after a long marriage and estate planning may also matter more.
Child custody is less likely to be a central issue when children are already adults. Instead, questions often focus on retirement income, health insurance, housing, and the ability to support two households after decades of marriage.
Key Takeaway
Although the overall divorce rate has declined, divorce among adults over 50 remains much more common than it was a generation ago. For families facing a later-life divorce, retirement, healthcare, housing, and long-term finances often deserve special attention.
Sources: National Center for Family & Marriage Research (NCFMR); Bowling Green State University; Pew Research Center.
Who Is Most Likely to Divorce?
Divorce rates are not the same for every group. Research has found connections between divorce and factors such as education, income, race, ethnicity, and age at marriage. These patterns help researchers understand national trends, but no single trait can predict what will happen in one marriage.
It is worth keeping that distinction in mind. Population data describes large groups of people—not you, your spouse, or the future of your relationship.
Divorce Demographics at a Glance
Adults with a bachelor’s degree or more education are less likely to have experienced divorce than adults whose education ended with high school.
Greater financial stability has been linked to lower divorce rates, while money problems can put more pressure on a marriage.
Divorce experience differs across racial and ethnic groups. Researchers caution that these gaps reflect a complicated mix of economic, educational, cultural, and historical factors—not race itself.
Education and Divorce
People with more education generally report lower rates of divorce. Pew Research Center found that about 25% of ever-married adults with a bachelor’s degree or more education had experienced divorce, compared with about 37% of those with a high school education or less.
Income and Divorce
Income is also connected to marital stability. Having more financial resources may reduce some of the money-related stress that can affect a marriage, while economic hardship has been linked to more conflict and a higher risk of divorce.
Race and Ethnicity
Pew Research Center found that about 41% of Black adults who had ever married had experienced divorce, compared with about 33% of White adults, 29% of Hispanic adults, and 16% of Asian adults. These differences should be read in context. They reflect overlapping economic, educational, cultural, and historical factors rather than race by itself.
Key Takeaway
Divorce rates differ across demographic groups, but a statistic cannot predict the future of one marriage. Education, income, age at marriage, and broader social conditions can all shape the patterns researchers see.
Sources: Pew Research Center; U.S. Census Bureau.
What Percentage of Divorces Are Initiated by Women?
Women initiated about 69% of divorces in one long-term study of heterosexual couples in the United States. Michael Rosenfeld’s study followed 2,262 adults with opposite-sex partners between 2009 and 2015 and found that women were more likely than men to report wanting the divorce.
This number applies to the people in that study. It is not a current count of every divorce filing in the United States.
The same study found that unmarried breakups were much more evenly initiated by men and women. The researcher suggested that traditional expectations in marriage, unequal household responsibilities, and a gap between expectations and daily life may help explain the difference. Those findings describe a broader pattern; they cannot explain why any one marriage ended.
Key Takeaway
Research suggests that women initiate most divorces in heterosexual marriages, but the 69% figure comes from one defined study rather than a national database of divorce filings.
Source: Michael J. Rosenfeld, How Couples Meet and Stay Together longitudinal study, presented to the American Sociological Association.
What Is the Most Common Reason for Divorce?
Lack of commitment was the most common major contributor reported in one peer-reviewed study of divorced people. Infidelity and frequent conflict or arguing came next. Most people named more than one cause, which is an important reminder that marriages rarely end for just one reason.
Commonly Reported Reasons Marriages End
- Lack of commitment
- Infidelity or affairs
- Too much conflict or arguing
- Marrying too young
- Financial problems
- Substance misuse or domestic violence
The order can change from one study to another based on who took part and whether researchers asked about major causes, the final event that led to divorce, or the legal reason listed in court papers.
The reasons for a divorce may also affect what happens during the legal process. Parents may need to work through child custody and child support. Safety concerns, substance misuse, or hidden money can also affect the information the court needs. Our guide to what can be used against you in a custody case explains when a parent’s actions and records may matter in a custody dispute.
Key Takeaway
Lack of commitment is often the most commonly reported major contributor, but divorce usually has several overlapping causes involving the relationship, money, behavior, or family life.
Source: Scott et al., “Reasons for Divorce and Recollections of Premarital Intervention,” Couple and Family Psychology.
Divorce Rates by State
Divorce rates can look very different from one state to another. Marriage patterns, age, education, income, military populations, and local economic conditions can all affect the numbers. That is why there is no single “average” divorce experience across the country.
The CDC publishes annual marriage and divorce statistics for participating states. NCFMR also uses Census Bureau data to compare refined divorce rates across all states and Washington, D.C.
States With Higher and Lower Divorce Rates
Although state rankings change from year to year, some states regularly report rates above or below the national average.
Which State Has the Highest Divorce Rate?
Oklahoma had the highest refined divorce rate in 2024, with 20.7 divorces per 1,000 married women. Nevada, Mississippi, Wyoming, and Alabama rounded out the five states with the highest rates.
Which State Has the Lowest Divorce Rate?
Maine had the lowest refined divorce rate in 2024, with 10.0 divorces per 1,000 married women. Wisconsin, New Jersey, Idaho, Montana, and South Carolina were also among the states with the lowest rates.
Why do divorce rates differ by state?
- Average age at marriage
- Education levels
- Household income
- Military population
- Urban vs. rural communities
- Economic conditions
- State reporting methods
A higher state divorce rate does not automatically mean marriages there are less successful. State rankings can be affected by age, military service, migration, and how the data is collected.
States with lower divorce rates also tend to have an older average age at marriage, higher education levels, and higher household incomes. Research has linked each of those factors with a lower divorce risk.
Key Takeaway
State divorce rates reflect more than what is happening inside individual marriages. Population, education, income, military service, and reporting methods can all affect where a state ranks.
Source: NCFMR analysis of 2024 American Community Survey data.
The Financial Impact of Divorce
The financial impact of divorce can go well beyond attorney fees. Knowing how much a divorce may cost can help you prepare for the legal process, but it is also important to think about property division, child support, spousal maintenance, retirement accounts, taxes, and the cost of maintaining two households.
A divorce that is resolved through agreement or mediation will usually cost less than a contested divorce that requires more court involvement. The total can vary widely based on how complicated the finances are, whether parents agree on the children, and how long it takes to reach a resolution.
What Can Affect the Cost of Divorce?
Business ownership, high-value assets, and complicated property division can increase legal costs. Our asset and debt division calculator can help you start organizing what you own and owe.
Disagreements about parenting time, decision-making, or child support may require more negotiation or court time. You can also read our guide to child custody statistics and trends for a closer look at parenting arrangements across the United States.
Spouses who can reach agreements outside of court often spend less than those involved in a long court fight.
Financial experts, custody evaluators, appraisers, and forensic accountants can add to the total cost.
The long-term financial impact of divorce often extends well beyond legal fees. Couples may also need to divide retirement accounts, refinance homes, update estate plans, establish separate insurance coverage, and adjust to maintaining two households instead of one. Property questions can begin even before the marriage ends, including what happens to property owned before marriage.
It can help to build a post-divorce budget before the divorce is final. Start with your expected housing, insurance, childcare, debt, and monthly living costs. Seeing those numbers early can help you spot problems and decide what matters most in a settlement.
A family law attorney can also help you identify financial questions early, understand your options, and avoid surprises that may be harder to fix later.
Key Takeaway
The cost of divorce is about more than attorney fees. Property, parenting issues, financial complexity, professional services, and conflict can all affect both the immediate cost and your finances after divorce.
Sources: American Bar Association; Institute for Divorce Financial Analysts; state court administrative reports.
Download the 2026 U.S. Divorce Statistics Fact Sheet
Download a short, source-backed summary of the latest U.S. divorce rate, marriage-length trends, gray divorce data, state comparisons, and other key findings.
Download the Divorce Statistics Fact Sheet
Publishers may use the fact sheet and original charts with attribution and a link to this article.
Frequently Asked Questions About Divorce Statistics
These answers cover some of the most common questions about U.S. divorce rates and marriage trends. They are based on the latest available research from the CDC, Pew Research Center, U.S. Census Bureau, and NCFMR.
What is the current U.S. divorce rate?
The current crude divorce rate is 2.4 divorces per 1,000 people, according to the CDC’s latest marriage and divorce data. That is one of the lowest U.S. divorce rates in almost 50 years.
Do 50% of marriages really end in divorce?
Not necessarily. The often-repeated 50% figure comes from older estimates and does not predict what will happen to marriages beginning today. Current data shows that divorce rates have fallen over the past several decades.
Why has the divorce rate declined?
Researchers point to several factors. People are marrying later, the married population has higher levels of education, many people wait for more financial stability before marrying, and fewer Americans marry overall.
How long does the average marriage last before divorce?
The median marriage ending in divorce lasted about 12 years in 2023. Many lasted much longer: more than one in five divorces happened after at least 25 years of marriage.
What is gray divorce?
Gray divorce generally means divorce after age 50. Divorce among older adults rose sharply for several decades before leveling off, and nearly 40% of divorces now involve someone age 50 or older.
Which state has the highest divorce rate?
The answer changes as new data is released. In NCFMR’s 2024 analysis, Oklahoma had the highest refined divorce rate at 20.7 divorces per 1,000 married women. Maine had the lowest at 10.0 per 1,000 married women.
What percentage of first marriages end in divorce?
There is no current lifetime percentage that applies to every first marriage. In 2023, the annual first-divorce rate was 13.4 per 1,000 women and 11.5 per 1,000 men in a first marriage. An older CDC study found that 43% of first marriages in a defined group ended in separation or divorce within 15 years, but that is not a current forecast for every first marriage.
What percentage of divorces are initiated by women?
Women initiated about 69% of divorces in one long-term study of heterosexual couples conducted between 2009 and 2015. That number describes the study group, not every divorce filing nationwide.
What is the most common reason for divorce?
Lack of commitment was the most common major contributor reported in one peer-reviewed study, followed by infidelity and frequent conflict or arguing. Most participants said more than one issue played a role.
Are divorce rates increasing?
No. The overall U.S. divorce rate has generally declined over the past four decades. Divorce among adults over 50 rose for many years, but the national trend is still downward.
Sources: CDC, Pew Research Center, U.S. Census Bureau, and NCFMR.
How Modern Family Law Can Help
Statistics can help you understand the bigger picture, but they cannot tell you what your divorce will look like. Your family, finances, priorities, and concerns are your own. What matters now is understanding your options and what each choice could mean for you.
Modern Family Law focuses on family law. We help people understand what happens next in divorce, child custody, child support, spousal maintenance, and property division. We listen first, explain the process clearly, and help you prepare for the decisions ahead.
Why Families Choose Modern Family Law
Our attorneys work with family law every day. That experience helps us spot the questions that may matter in your divorce and explain them in a way that is easier to understand.
No national statistic can capture your family or your priorities. We take the time to understand what is happening, what you are worried about, and what you want life to look like after divorce.
We help you understand the process, the likely next steps, and the choices in front of you. You should leave each conversation knowing more than when you started.
Divorce Statistics Tell a Story and Your Story Is Still Being Written
Divorce statistics can explain broad trends, but they do not decide your future. The choices ahead may affect your children, your finances, your home, and your day-to-day life. Good information can help you focus on the decisions that matter most.
When you are ready to talk, our family law team can listen to what is happening, answer your questions, and explain what your next steps may look like.


